
Select the arbitration-phase rate.
CAN FD capture and incident diagnostics
Xilume TraceBox Analyzer Pro
Monitor live CAN and CAN FD traffic, transmit frames, visualize signal and bus-activity trends, and preserve evidence around communication faults.
Version 1.0.0
01
Transmit and receive
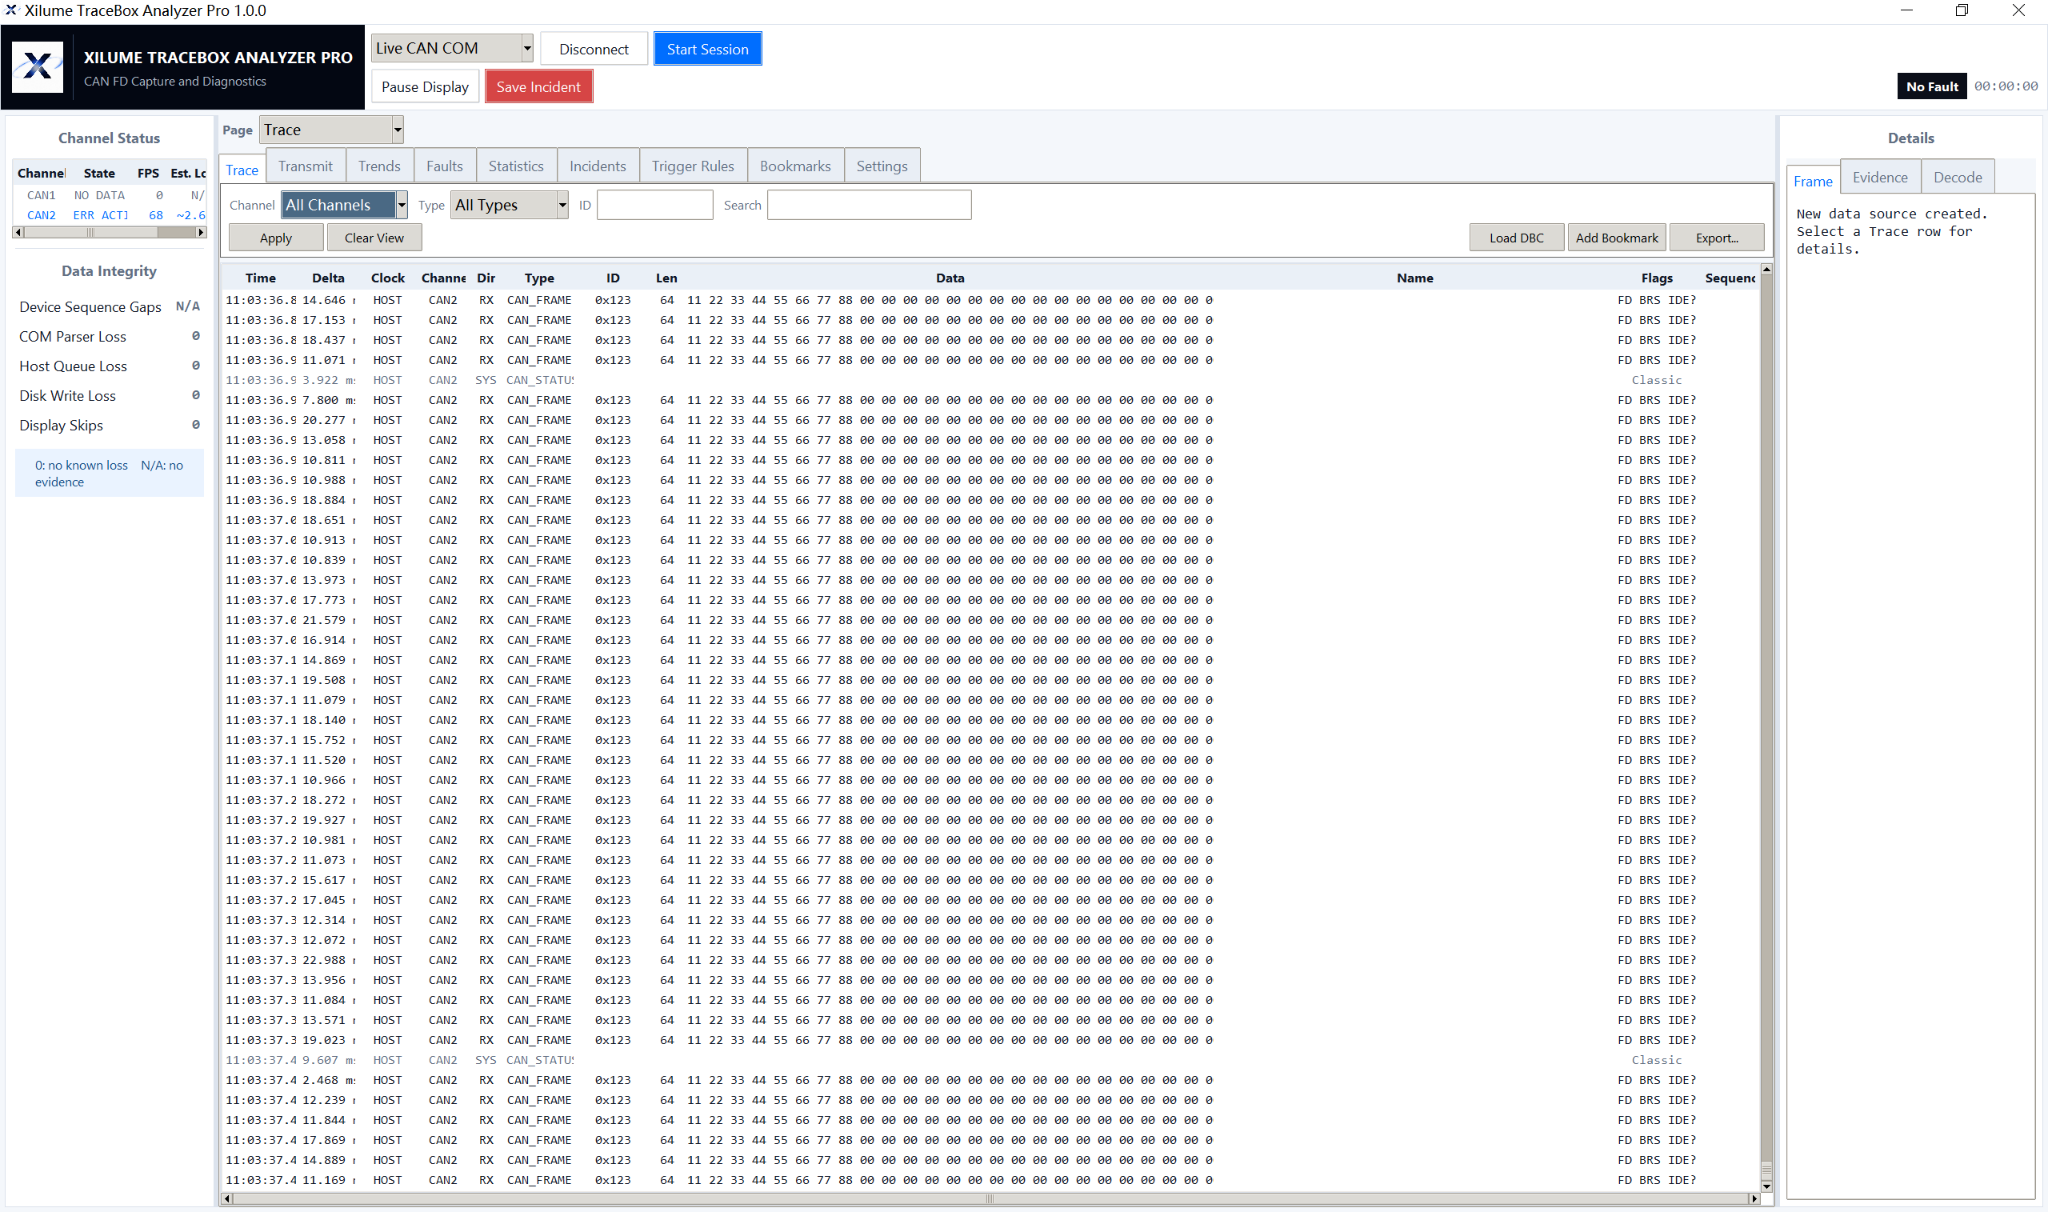
Capture live CAN and CAN FD frames with channel, type, ID and payload filters. Use the transmit workspace to send controlled Classical CAN or CAN FD frames from the same application.
Classical CAN
CAN FD and BRS
Live filtering
DBC loading
CSV export
Bookmarks
02
Signal and bus-activity trends
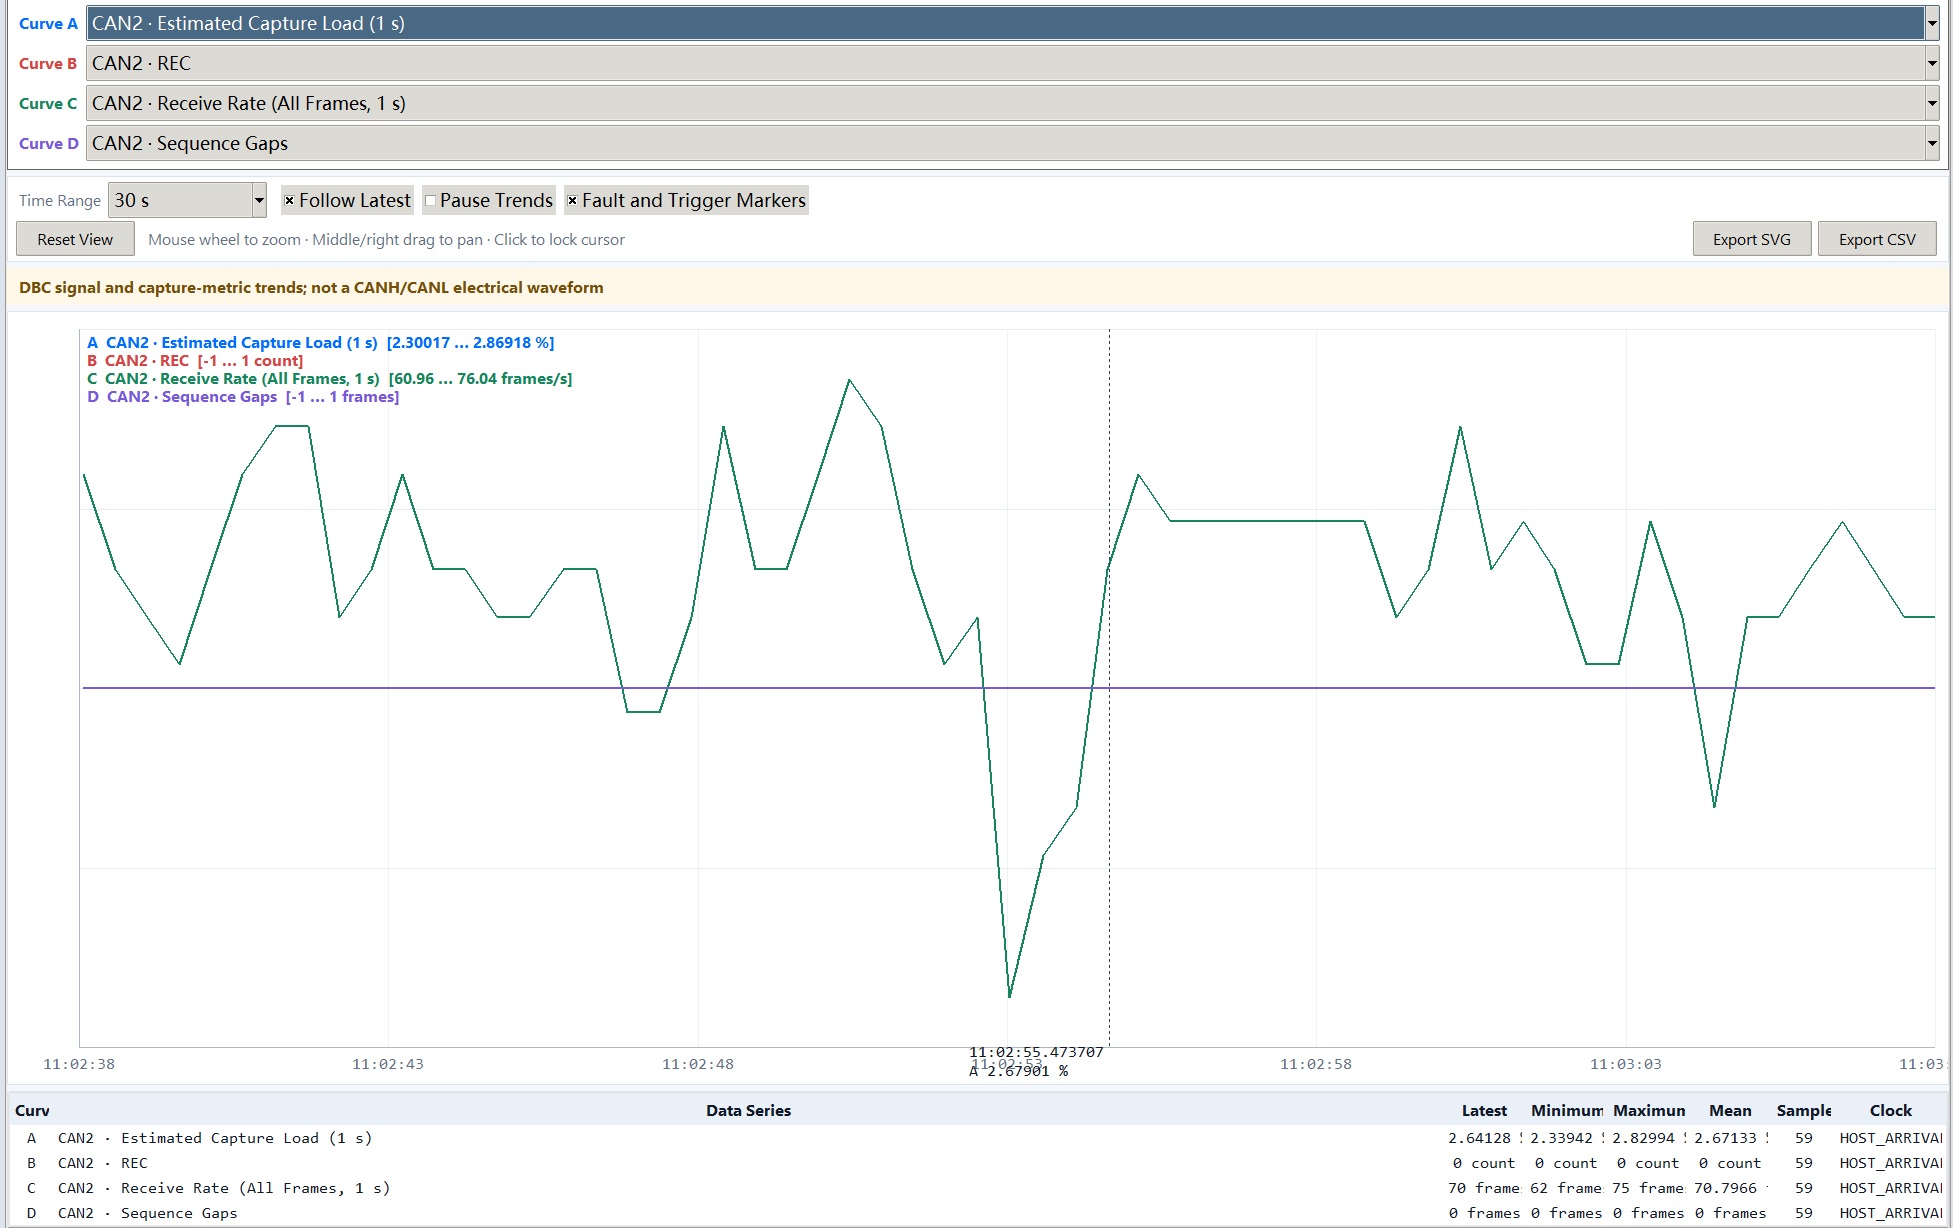
Plot DBC signals and capture metrics such as receive rate, estimated capture load, error counters and sequence gaps. Follow live data, mark fault events, and export SVG or CSV.
Software signal and capture-metric trends, not CANH or CANL electrical waveform measurement.
03
Bit timing and diagnostic storage
Configure the interface for normal CAN operation, set nominal and data-phase bitrates, define trigger windows, and choose where incident packages are stored.
Set the CAN FD data-phase rate.
Keep evidence before and after a trigger.
Choose package location, log size and quota.
04 · Sample diagnostic case
Manual CAN FD communication interruption
In this sample, CAN FD communication was manually disconnected. TraceBox detected the resulting CAN2 ID 0x123 timeout, preserved the incident window, and ranked practical follow-up checks without claiming an unproven root cause.
Affected scopeCAN2 · 0x123
Learned period≈ 14 ms
Timeout250 ms
Incident window60 s before · 10 s after
Portable incident evidence
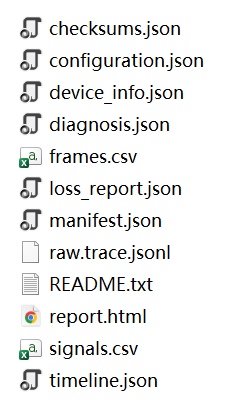
Each package keeps the report together with trace, configuration, timeline and integrity records for review or handoff.
- HTML report
- Raw trace
- Frames CSV
- Signals CSV
- Timeline
- Checksums
Compatible hardware and drivers
Use TraceBox Analyzer Pro with a compatible Xilume CAN or CAN FD interface in normal operating mode.